

What you will accomplish
You will open the Payments overview page, read the three summary numbers at the top, change the date range when you need a different time period, and use the Insights charts to answer questions such as “How much did we collect this month?” and “Who still owes us money?” This guide is for owners, managers, and billing staff who want a quick picture of facility income—not for creating a single invoice (use Create an invoice for that).When to use the overview page
- You want a morning check-in on collected revenue, open invoices, and past-due balances.
- A manager asks for numbers for “this month,” “last 30 days,” or a custom date range.
- You need charts that show revenue mix, collection speed, or customer billing trends.
- You are deciding whether to jump to Invoices, Quotes, Recurring, or Products & Services next.
Overview vs other Payments pagesThe overview page shows totals and trends. To change one customer’s bill, open Payments > Invoices. To edit pricing items, open Products & Services.
Before you start
- Your facility has finished Connect payment processing so the overview can load real numbers.
- Your staff account can open Payments in the dashboard sidebar.
- Use a desktop or laptop with a wide screen for charts. Phones show the summary cards but may hide the large revenue chart.
When payment processing is not set up yet, clicking Payments may open Settings > Billing instead of the overview. An owner or admin should finish payment setup first. See Payments overview.
Open the Payments overview
1
Click Payments in the sidebar
Sign in to your dashboard. In the left sidebar, click Payments.You can also go directly to Payments overview.Expected result: The page title at the top says Payments Overview. Below it you see a date range label such as Last 30 days.
2
Wait for numbers to finish loading
The three summary cards may show dashes or Loading… for a few seconds the first time you open the page.Why this matters: The page pulls live totals from your payment account. Acting on half-loaded numbers can cause confusion.Expected result: Collected Revenue, Accounts Receivable, and Past Due show dollar amounts—not loading text.
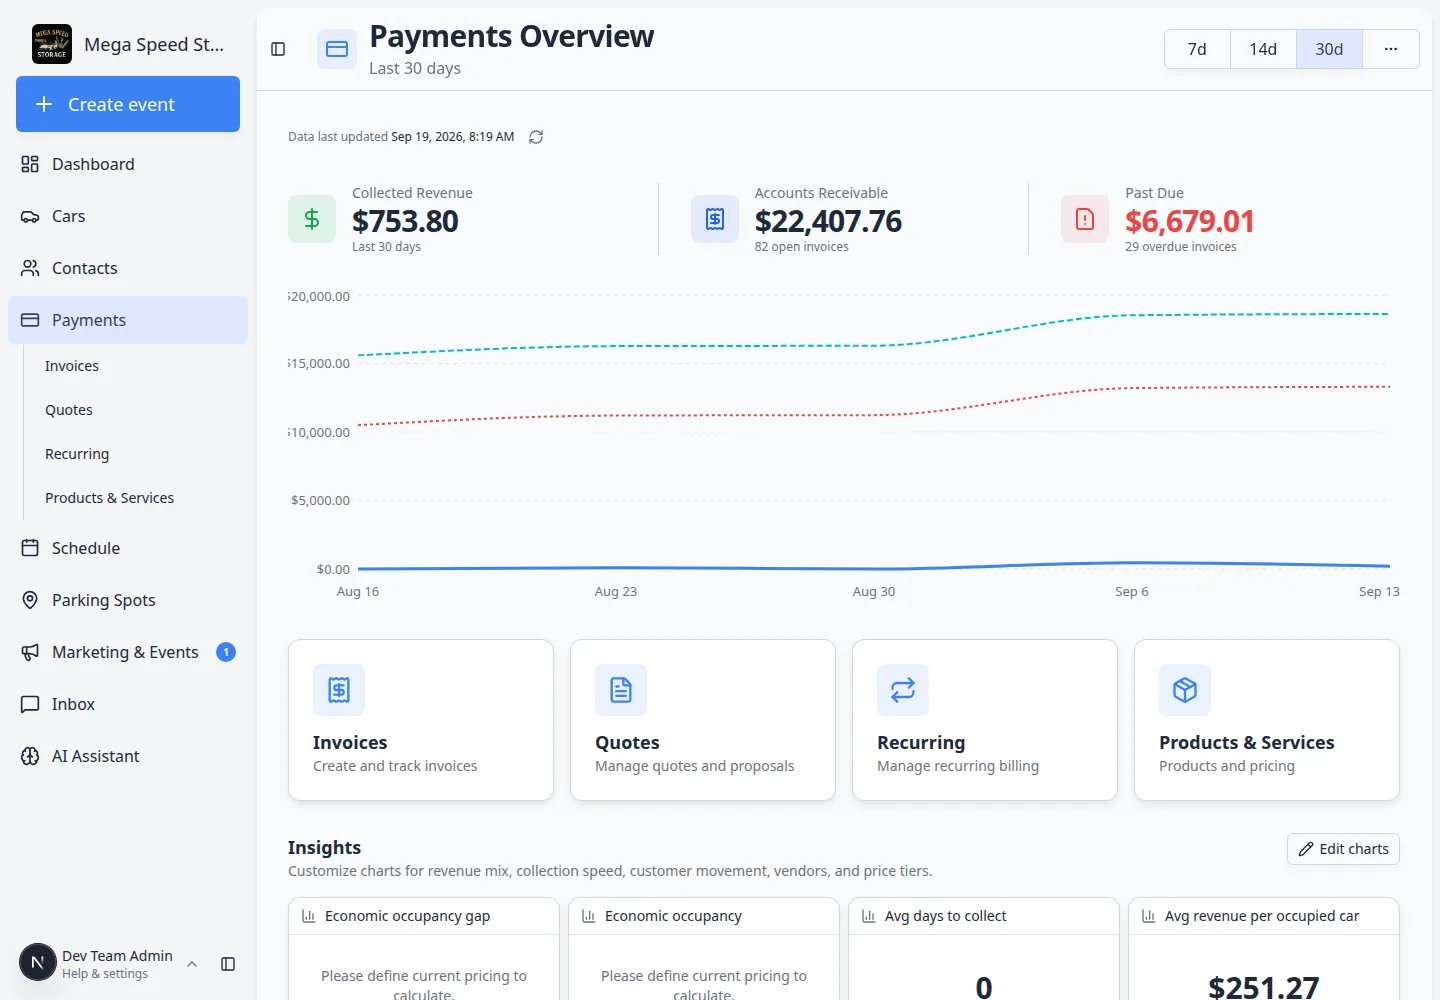
Read the three summary cards
Each card answers a different question. Read them together—not just one in isolation.Collected Revenue — Money your facility actually received during the date range you selected (for example card payments and bank transfers that cleared).Accounts Receivable — Money customers still owe on open invoices right now. The small text under the dollar amount shows how many open invoices make up that total.Past Due — Part of accounts receivable that is overdue based on each invoice’s due date. When this number is above zero, the card is highlighted so your team notices follow-up work.
Change the date range
The date range controls Collected Revenue and the main chart. It does not erase open invoices from Accounts Receivable—that card always reflects what customers owe right now.1
Use the quick buttons
Near the top-right of the page, click 7d, 14d, or 30d for a fast look at the last week, two weeks, or month.Expected result: The subtitle under Payments Overview updates (for example Last 7 days). The Collected Revenue card and chart refresh.
2
Open more date choices
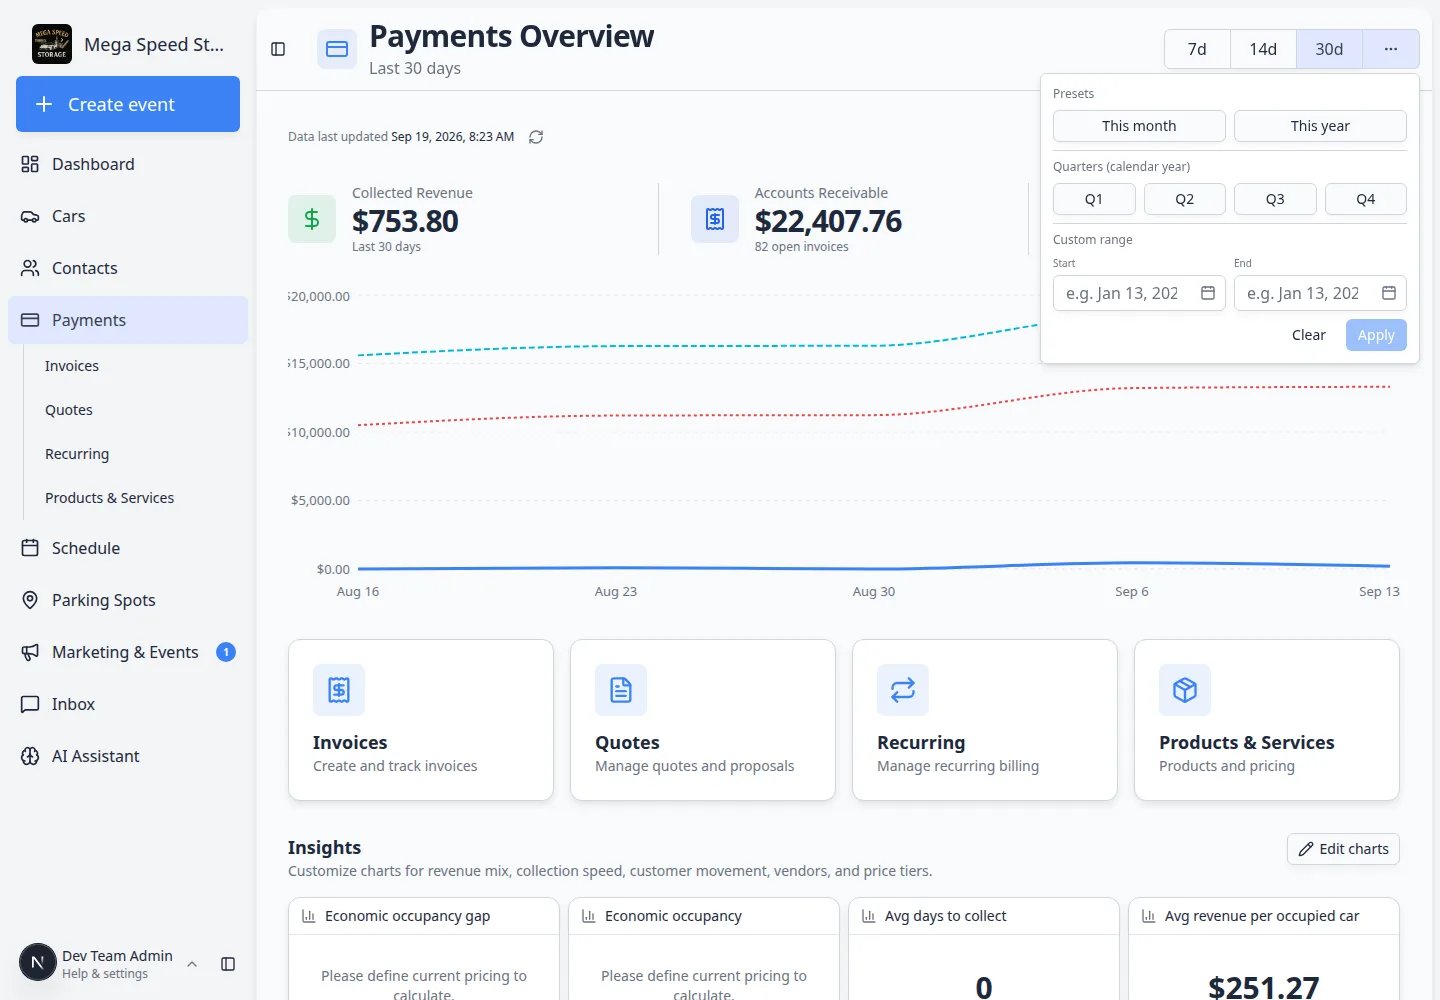
Click the ⋯ (three dots) button next to the quick buttons.Expected result: A panel opens with presets such as This month, This year, calendar quarters (Q1–Q4), and Custom range start/end dates.
3
Pick a preset or custom range
Click a preset, or choose Start and End dates and click Apply.Why this matters: Owners often ask for “this quarter” or a specific month. Presets save time compared with counting days by hand.Expected result: The subtitle shows your chosen range. Totals and the chart update to match.
Read the revenue chart
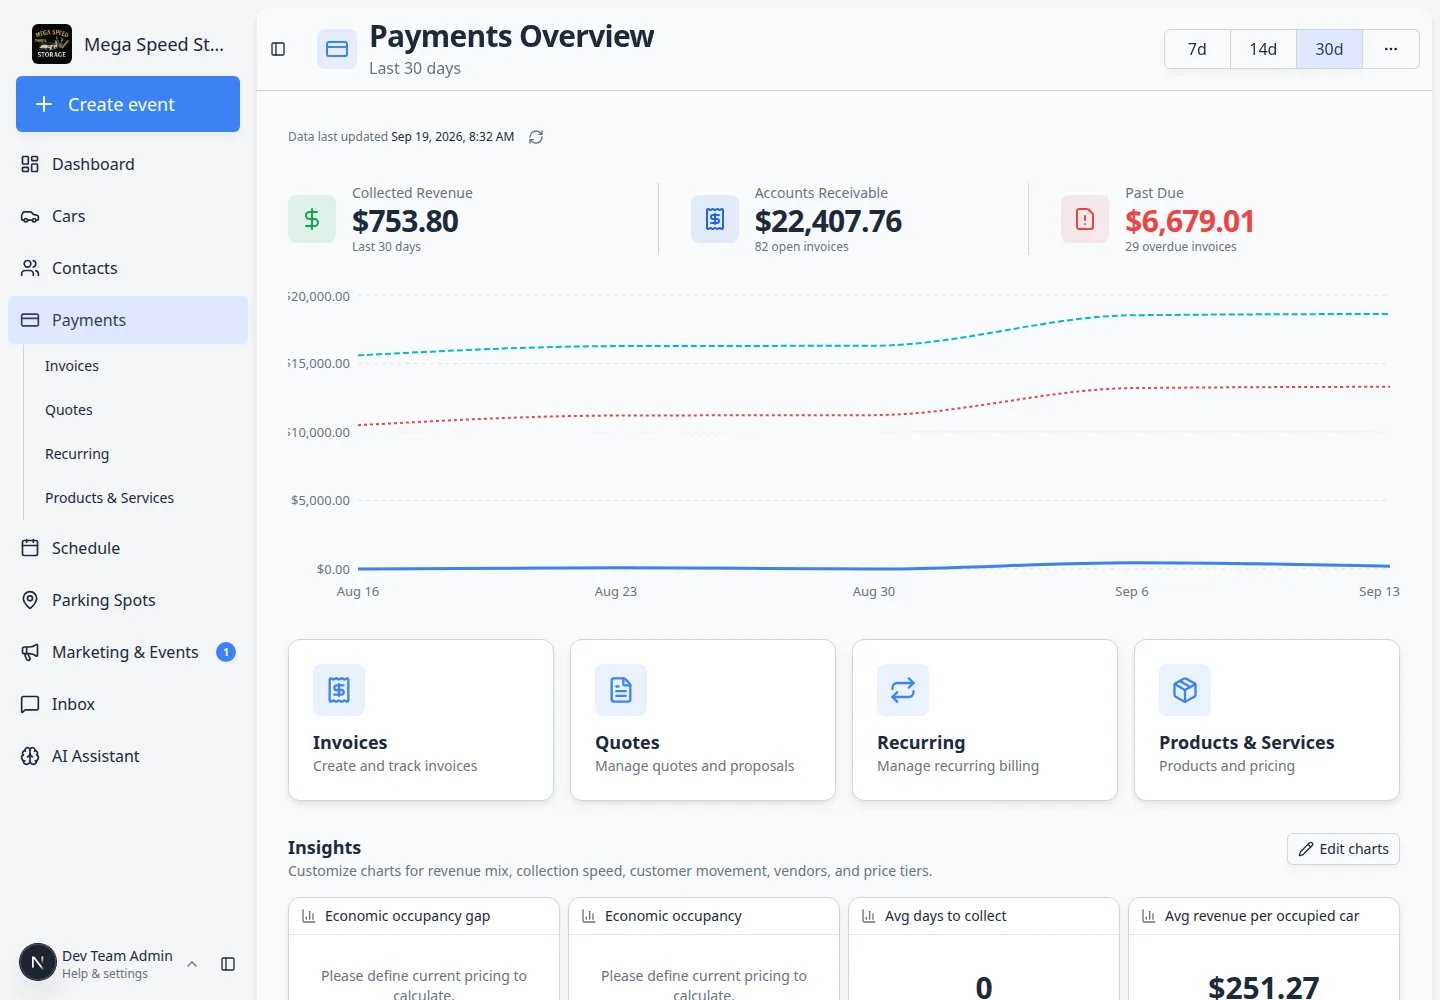
On a wide screen, a line chart appears below the summary cards. It helps you spot trends—not replace your accounting system.1
Find the chart
Scroll slightly below the three summary cards if needed.Expected result: You see a line chart with dates along the bottom and dollar amounts up the side.
2
Understand each line
- Revenue (solid line) — Collected income for each day or bucket in your date range.
- Accounts Receivable (dashed line) — How much was still owed over time.
- Past Due (dotted line) — Overdue portion over time.
3
Hover for exact amounts
Move your pointer over a point on the chart to see precise dollar values for that day or period.Expected result: A small tooltip shows the label and amount for each line.
Approve vehicle billing updates
The Vehicle billing updates panel sits at the top of the Payments overview by default. It lists recurring billing changes from car dropoffs and pickups that need a decision, such as adding a car to a line item or removing a car that left. Pick a line item if needed, then click Approve or Dismiss. Open the Recent tab to review past changes. See Automate billing updates on dropoff and pickup to choose what happens on dropoff and pickup.Jump to daily work with quick navigation cards
Below the chart you will see four large cards:- Invoices — Create and track customer and vendor bills.
- Quotes — Send pricing for customer approval.
- Recurring — Manage monthly storage and memberships.
- Products & Services — Edit reusable line items.
Customize Insights charts
Scroll to the bottom of the overview page to find the Insights section. Here you can add charts that matter to your role—such as revenue by product, aging receivables, or customer movement.1
Scroll to Insights
On Payments overview, scroll past the quick navigation cards until you see Insights.Expected result: You see one or more chart panels—or an empty area ready for charts.
2
Click Edit charts
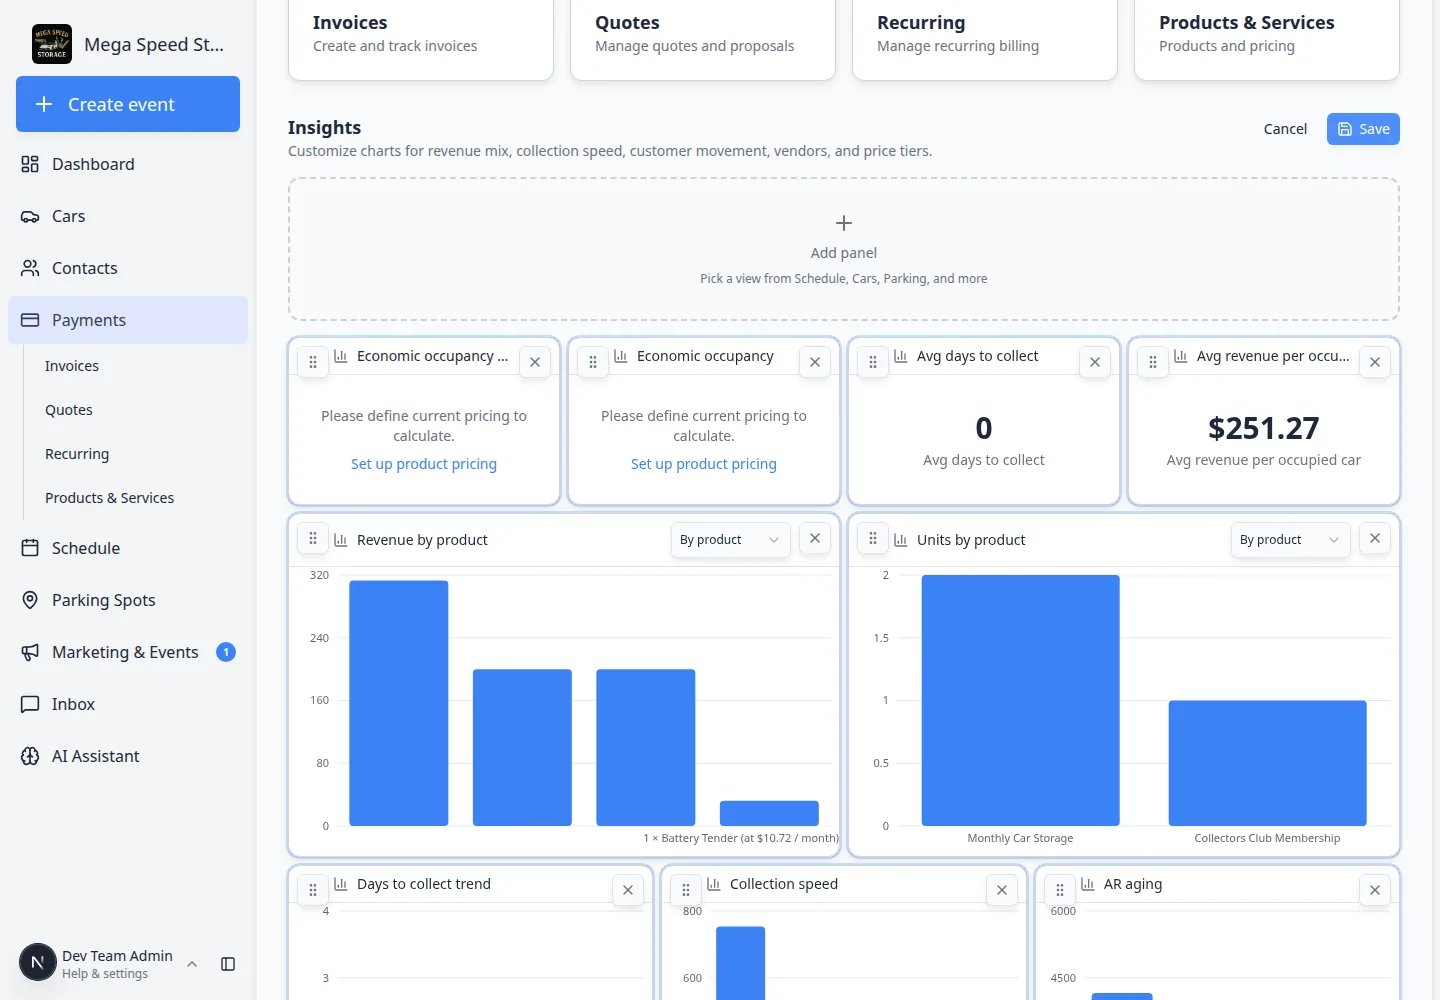
Click Edit charts in the Insights section header.Why this matters: Edit mode lets you add, remove, resize, and rearrange charts without changing customer invoices.Expected result: The page shows chart placeholders, an Add chart (or similar) control, and save/cancel choices.
3
Add or remove charts
Click Add panel to pick a chart (for example revenue mix, collection speed, or vendor totals). Drag panels to rearrange them. Use the X on a panel to remove charts you do not need.Expected result: Your layout shows only the metrics your team actually uses.
4
Save your layout
Click Save (or Done) when the layout looks right.Expected result: Insights returns to normal view with your chosen charts. Your layout is remembered for the next time you sign in.
Team default vs your personal layoutTeam admins can set a default Insights layout for new staff. Your personal changes usually apply only to your account unless your facility uses a shared team layout. If charts look different between teammates, ask an admin who manages dashboard layouts.
Common mistakes to avoid
- Do not confuse Collected Revenue with Accounts Receivable—one is money received; the other is money still owed.
- Do not panic when Past Due is red—open Invoices and follow up using Send and collect customer payments.
- Do not expect the chart on a phone—use a computer for the full trend view.
- Do not edit invoices from the overview page—use the Invoices card or sidebar link instead.
Troubleshooting
What success looks like
- You can open Payments overview and explain all three summary cards to a teammate.
- You can switch the date range to answer a manager’s question without opening each invoice.
- Your Insights section shows charts your facility actually uses—not an empty page you ignore.
- When Past Due rises, your team knows to open Invoices next.
What to do next
- Bill a customer today → Create an invoice
- Follow up on unpaid bills → Send and collect customer payments
- Set up monthly storage charges → Manage recurring billing
- Update plans when cars arrive or leave → Automate billing updates on dropoff and pickup
- A customer said yes to a quote → When a customer accepts a quote
- Return to the big picture → Payments overview